From simple to complex
Just how difficult it is to get from the least complex to the most complex can be shown in a simple visual presentation (opposite), where groups of industries are shown by coloured dots. If industries are connected and complex, they group together densely in the middle. If they are simple and unconnected, they remain scattered around the edges of the graphic.
In 1975 Ghana had largely industries that were low in complexity and not connected to other industries. By 2010 this had developed somewhat, but not much. There is more connection and a little more complexity, but the overall pattern is still largely the same.
Yet when you compare the case of Turkey over the same years, the difference is very striking. Starting with a little more complexity and a little more connectedness, by 2010 the Turkish economy had become a lot more complex, with industries bunching together in the middle of the product space where industries are most complex and most connected – and most profitable.
In short, if you start with something with some complexity, you can get more complex. Just as the rich get richer, the complex get more complex. If you start well you can get better – for the rest, there is an awful lot of work to do. But there is one other unusual conclusion from this research: the best-placed countries for future growth are not the most complex. The countries with the most complex economies such as Japan and the US face the problem of having nowhere to go – they have fully occupied the complex space, and there are no new industries for their existing industries to connect to and grow. The only way they can grow is by inventing entirely new complex industries – possible but difficult.
Much better placed are economies in the middle, with some level of complexity and lots of opportunities to become more complex by extending into new but similar industries.
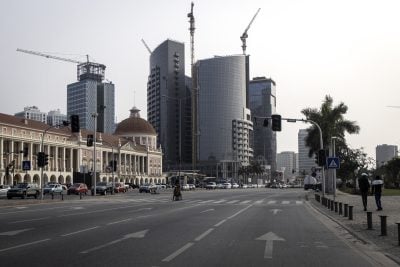
The worst off are those with very simple export industries that are not connected to anything else. So according to this analysis, countries like oil-rich Nigeria and Angola are the worst-placed for balanced growth. They will be wealthy so long as the oil flows and the world is willing to pay for it, but to get away from that dependence will be very difficult.
Countries that are poorer but with considerably more complex economies like Kenya and Zimbabwe are very much more likely to grow whatever happens to the natural resource economy. So, surprisingly, Zimbabwe appears as a much lower-risk economy than Nigeria. It is not a complete picture. The Atlas does not include trade in services, an increasing part of the sub-Saharan economy, that may become its most significant part. It is corrected for natural resources wealth, and that is real even if it is volatile. But as a picture of the long-term prospects of many African economies, beyond the day when the oil runs out and the commodity price cycle turns down again, it is very revealing. The message is, get complex or stay poor.
Want to continue reading? Subscribe today.
You've read all your free articles for this month! Subscribe now to enjoy full access to our content.
Digital Monthly
£8.00 / month
Receive full unlimited access to our articles, opinions, podcasts and more.
Digital Yearly
£70.00 / year
Our best value offer - save £26 and gain access to all of our digital content for an entire year!